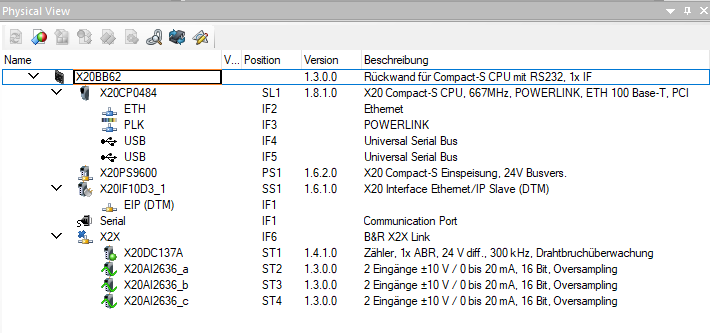
I’m currently working on the hardware shown. I wanted to see my CPU usage in the Profiler to avoid a cycle error in my 500 μs task. However, my Profiler doesn’t show anything, even when I copy the program and the Profiler settings from the online training module (TM223 subsection 5). It always says “no data”.
I solved the issue (kind of). It seems like the problem was a corrupted file anywhere in the project. I plugged the PSU out and restarted the PLC, created a new Project in a new save folder, loaded it in and now it works with no problems. In the old project it still has the problem but i can copy the code to the new one.